
This series focuses on a few main problems with accessibility in academic research, but by no means are they they only ones. My last post covered problems concerning graphs and how we can improve them to be more accessible to color blind individuals. If you’re curious about other accessibility considerations, take a look at Anne Gibson’s Alphabet of Accessibility on the Pastry Box Project; it’s fantastic.
Images, graphs and other non-text items in research
As I mentioned in my previous post, lots of scholarly research relies of graphs and charts to represent data and results. Additionally, researchers use images and other non-text items (such as equations) in research. However, without proper alternative text, these visual representations are meaningless to users with certain visual impairments.
What is alternative text and who needs it?
Alternative text, or alt text, displays when an image has trouble loading (you may see them in emails where you have to click to allow the images to display). Screen readers will read the alt text aloud when they encounter an image. A screen reader is a type of software that reads text out loud. Many people who have moderate to severe visual impairments use them when reading websites, email, and other forms of electronic documents on computers and mobile devices. I also know someone who has an Autism Spectrum Disorder. They used a screen reader to read websites because they found website design to be too overwhelming for them.
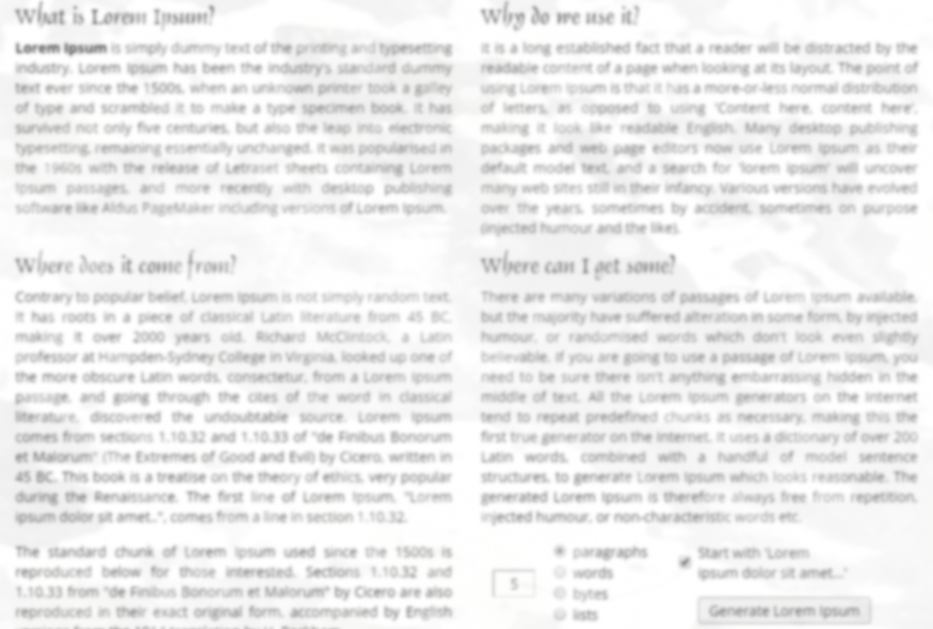
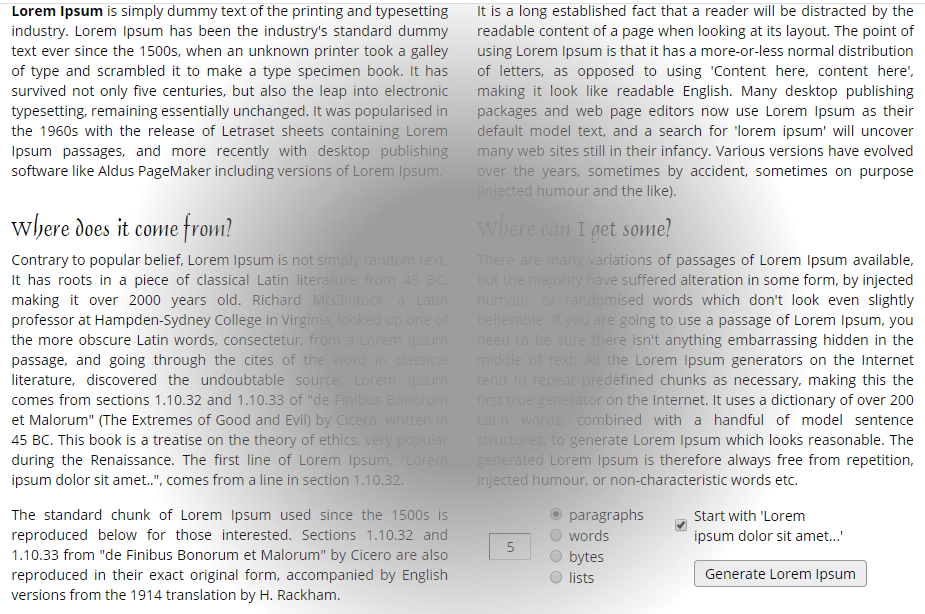
When we think of visual impairments, we often think of individuals who are totally blind. However, some of the most common visual impairments (according to the World Health Organization) are cataracts, macular degeneration, glaucoma, and diabetic retinopathy. Chances are that you’ve at least heard of one of those terms, and you may even know someone who has one of them.
To help you all visualize what those terms mean, I’m going to show you what moderate to severe cases of some of the above disorders look like when viewing items. The point here is to show why someone might use a screen reader. The point is not whether text or images are readable with a particular type of visual impairment & severity level.
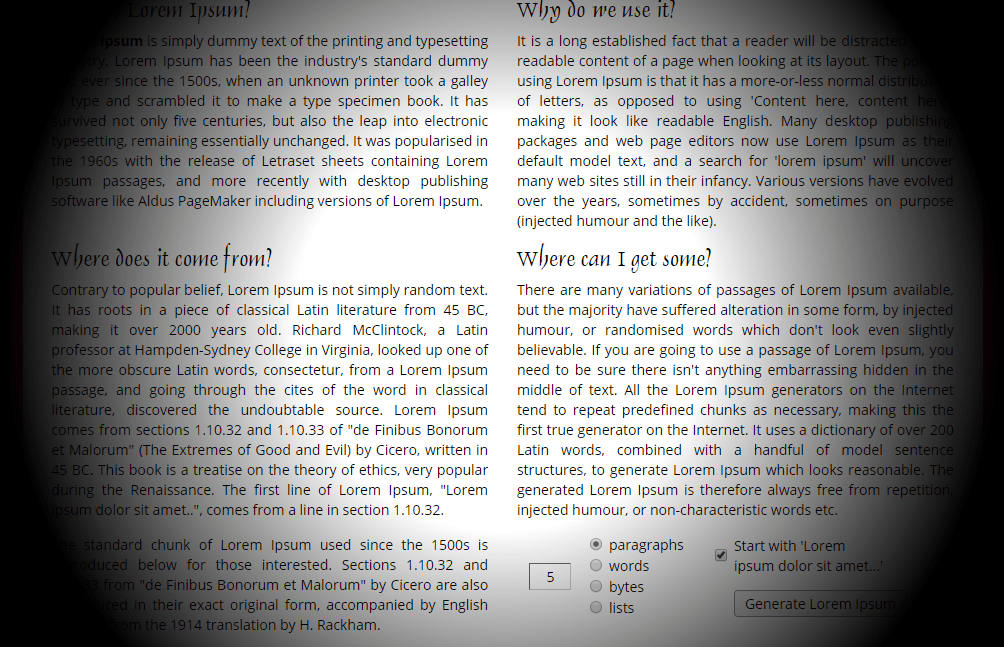
Again, the above images demonstrate why someone may not be able to fully read research without assistive technology, or why they might choose to use assistive technology to aid their reading.
What items need alt text and how do I add it?
To figure out what items in your research/electronic publications need alt text, imagine reading your research out loud to someone. Wherever you encounter something that you have to describe to them so they can understand the publication, that item needs alt text.
For example, the images I listed above need alt text. Someone who can’t see those images wouldn’t know (without alt text) what a website looks like for someone with glaucoma. Other visual elements like graphs and equations need alt text as well.
Adding alt text in Microsoft Word
Graphs
In Microsoft Word adding in alt text is pretty straightforward. After you’ve created your graph, right click on it. You’ll get a popup menu, and you should select “Format Chart Area,” the last item in the menu. If you see “Format Chart Title” or “Format Chart Plot,” go back, select the whole graph and right click again until you get the ‘Format Chart Area” option.
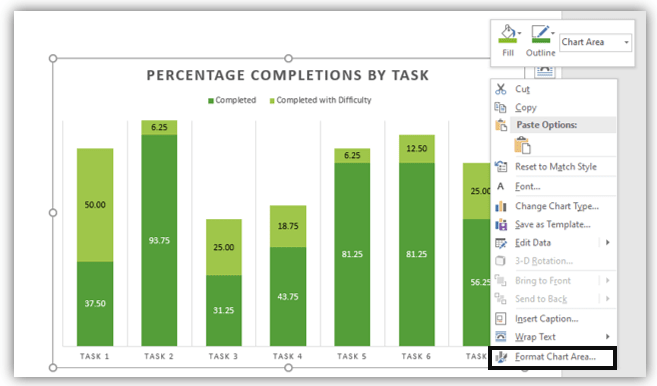
A menu on the right will appear that says “Format Chart Area” at the top.
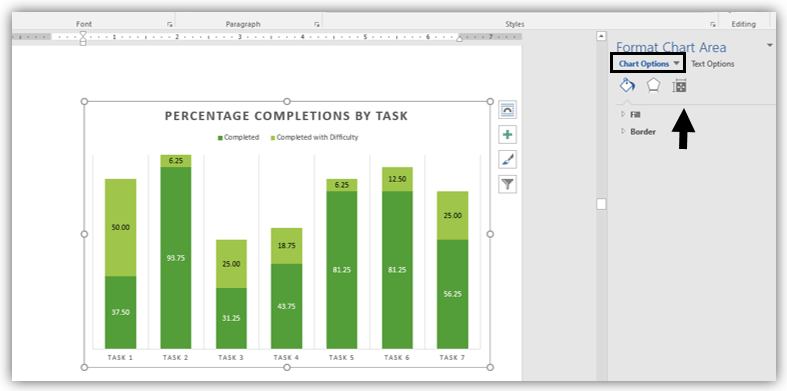
From there, while staying in the chart options selection, select the icon that looks like an Excel sheet. It should be the the third from the left, and it is called “Layout & Properties.”
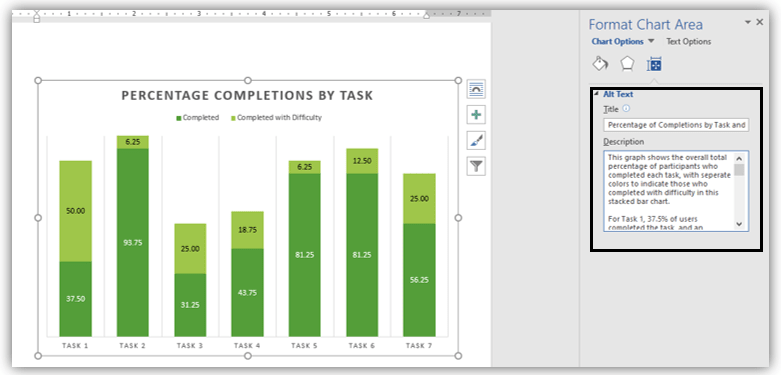
Once you’ve selected that, you’ll see an area to add in a title to your figure and a description of what your figure is showing. When entering in alt text, think about how you would describe the image if you were reading your document aloud to someone. What is the information they need to know? The example you see here is from my own report I wrote this past year.
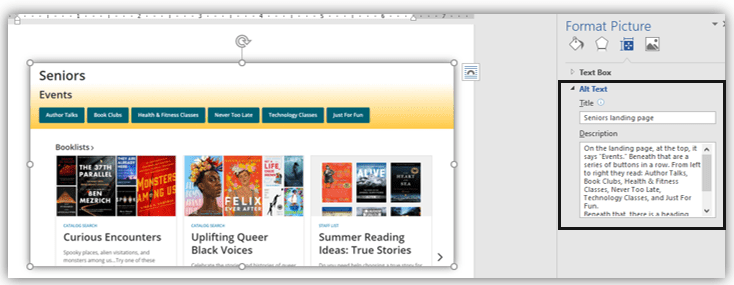
Images
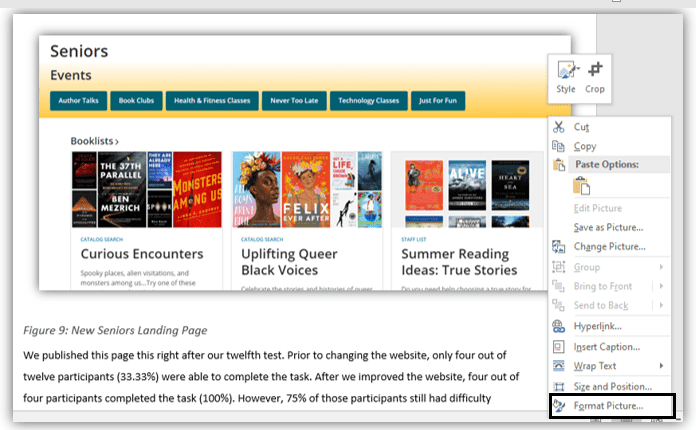
The steps for adding alt text to images are basically the same as the ones for a graph. Right click the image, and you’ll see a menu that pops up. Select the last item in the menu “Format Picture.”
A menu will appear on the right side of the document. From there, select the icon that looks like an Excel sheet. It should be the the third from the left, and it is called “Layout & Properties.”
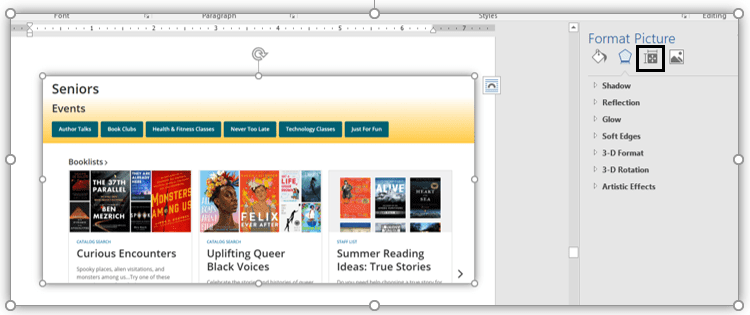
After you’ve clicked that icon, it may open up straight to alt text, or you may have to choose the option “alt text” from two choices that appear. Once you’ve selected the alt text option, you can enter in the title and description of the image. When entering in alt text think about how you would describe the image if you were reading your document aloud to someone. What is the information they need to know?
Equations
While Word does have a way to make equations look nice in your document, these equations are not accessible to screen readers. Instead, it is recommended that you use MathType for Windows to create equations. With this, users with screen readers can read the equation directly in the document. It can also be converted into other formats, such as braille. ASCII text, MathML, and LaTex can be copied and pasted into MathType to be converted into accessible text.
LaTex
I’m going to start off this section by acknowledging that LaTex doesn’t have neat solutions for all of this. They are actively working on solutions for making their documents more accessible, but they haven’t finished work on this project. Future publications/updates on this project will appear on the LaTeX project site.
Equations
For most of this section, I’m relying on a paper written by Ulrike Fischer in 2020 in TUGboat, v.41 no.1. Academics who use LaTex often have to deal with equations. There are a few possibilities here to make equations accessible (check out section 9 of Fischer’s paper). One solution involves using the axessibility package in LaTex. It should automatically add alt text to equations, but it does require the user to know LaTex input syntax, and it’s not clear how well it works in generating the alt text automatically.
Another possibility here is to mark all the equations with MathML structure names, and this should be easier to automate in LaTex. One last option is to to convert the equations into MathML, using MathJax and attach the MathML as an associated file to the structure.
Alt text for graphs & images and tagged documents
There is a known issue with LaTex not being able to convert into appropriately marked PDFs so that screen readers can use them. The LaTex project mentioned at the beginning of this section aims to fix that, but it is estimated to take an additional 2-4 years from now.
But, LaTex can be converted to Microsoft Word using Pandoc and users can follow the above instructions to manually enter in their alt text there.
Additionally, you can convert your LaTex into a PDF and use Adobe Acrobat to add alt text within your document. Here is Adobe’s guide on adding alt text to your document. It should be noted that this feature is only available to those who have Adobe Acrobat and not Adobe Reader.
So that’s all I’ve got. I know that I haven’t covered everything. Hopefully this is enough to get you started, and help you find answers to what I haven’t covered.
